Example of producing plots using HIIdentify_plots
HIIdentify_plots provides a number of functions to produce various plots using the output files from HIIdentify.
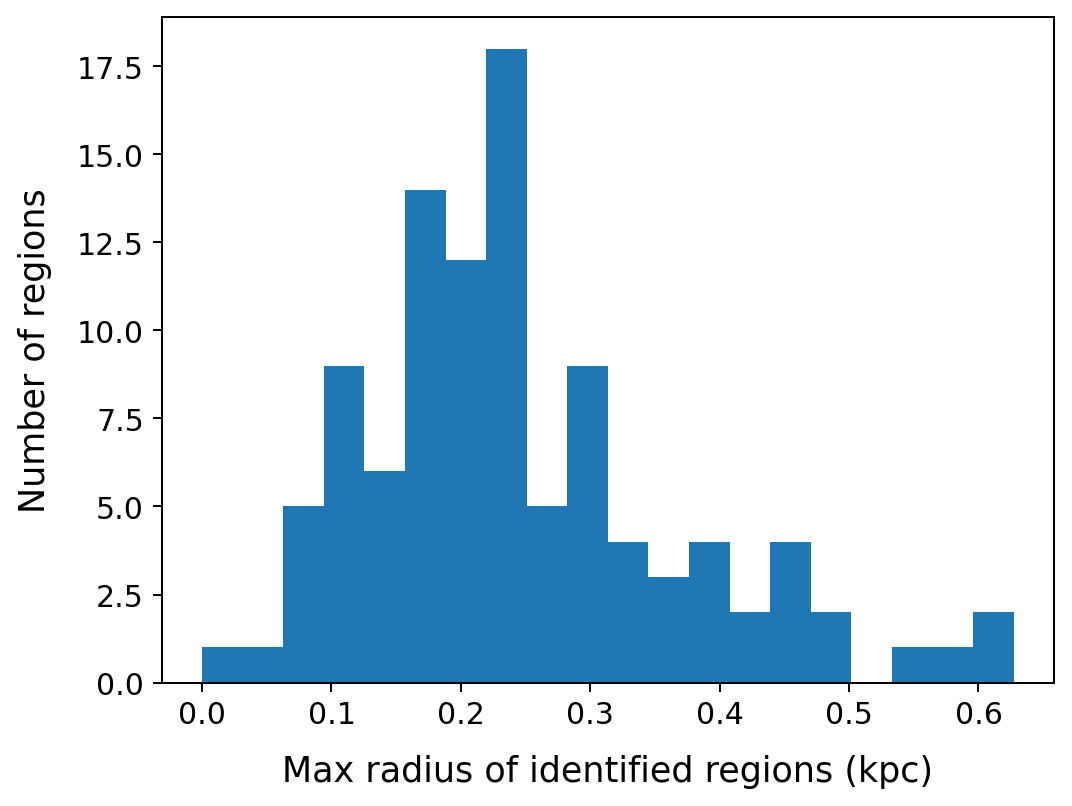
distr_of_region_sizes plots a histogram of the sizes of the identified regions, using the produced HIIdentify segmentation map.
from HIIdentify import HIIdentify_plots
HIIdentify_plots.distr_of_region_sizes(seg_map_fname='NGC1483_HII_segmentation_map.fits',
                                        tdir='./')
A plot is saved in our target directory (tdir) as ‘size_of_identified_regions.png’.
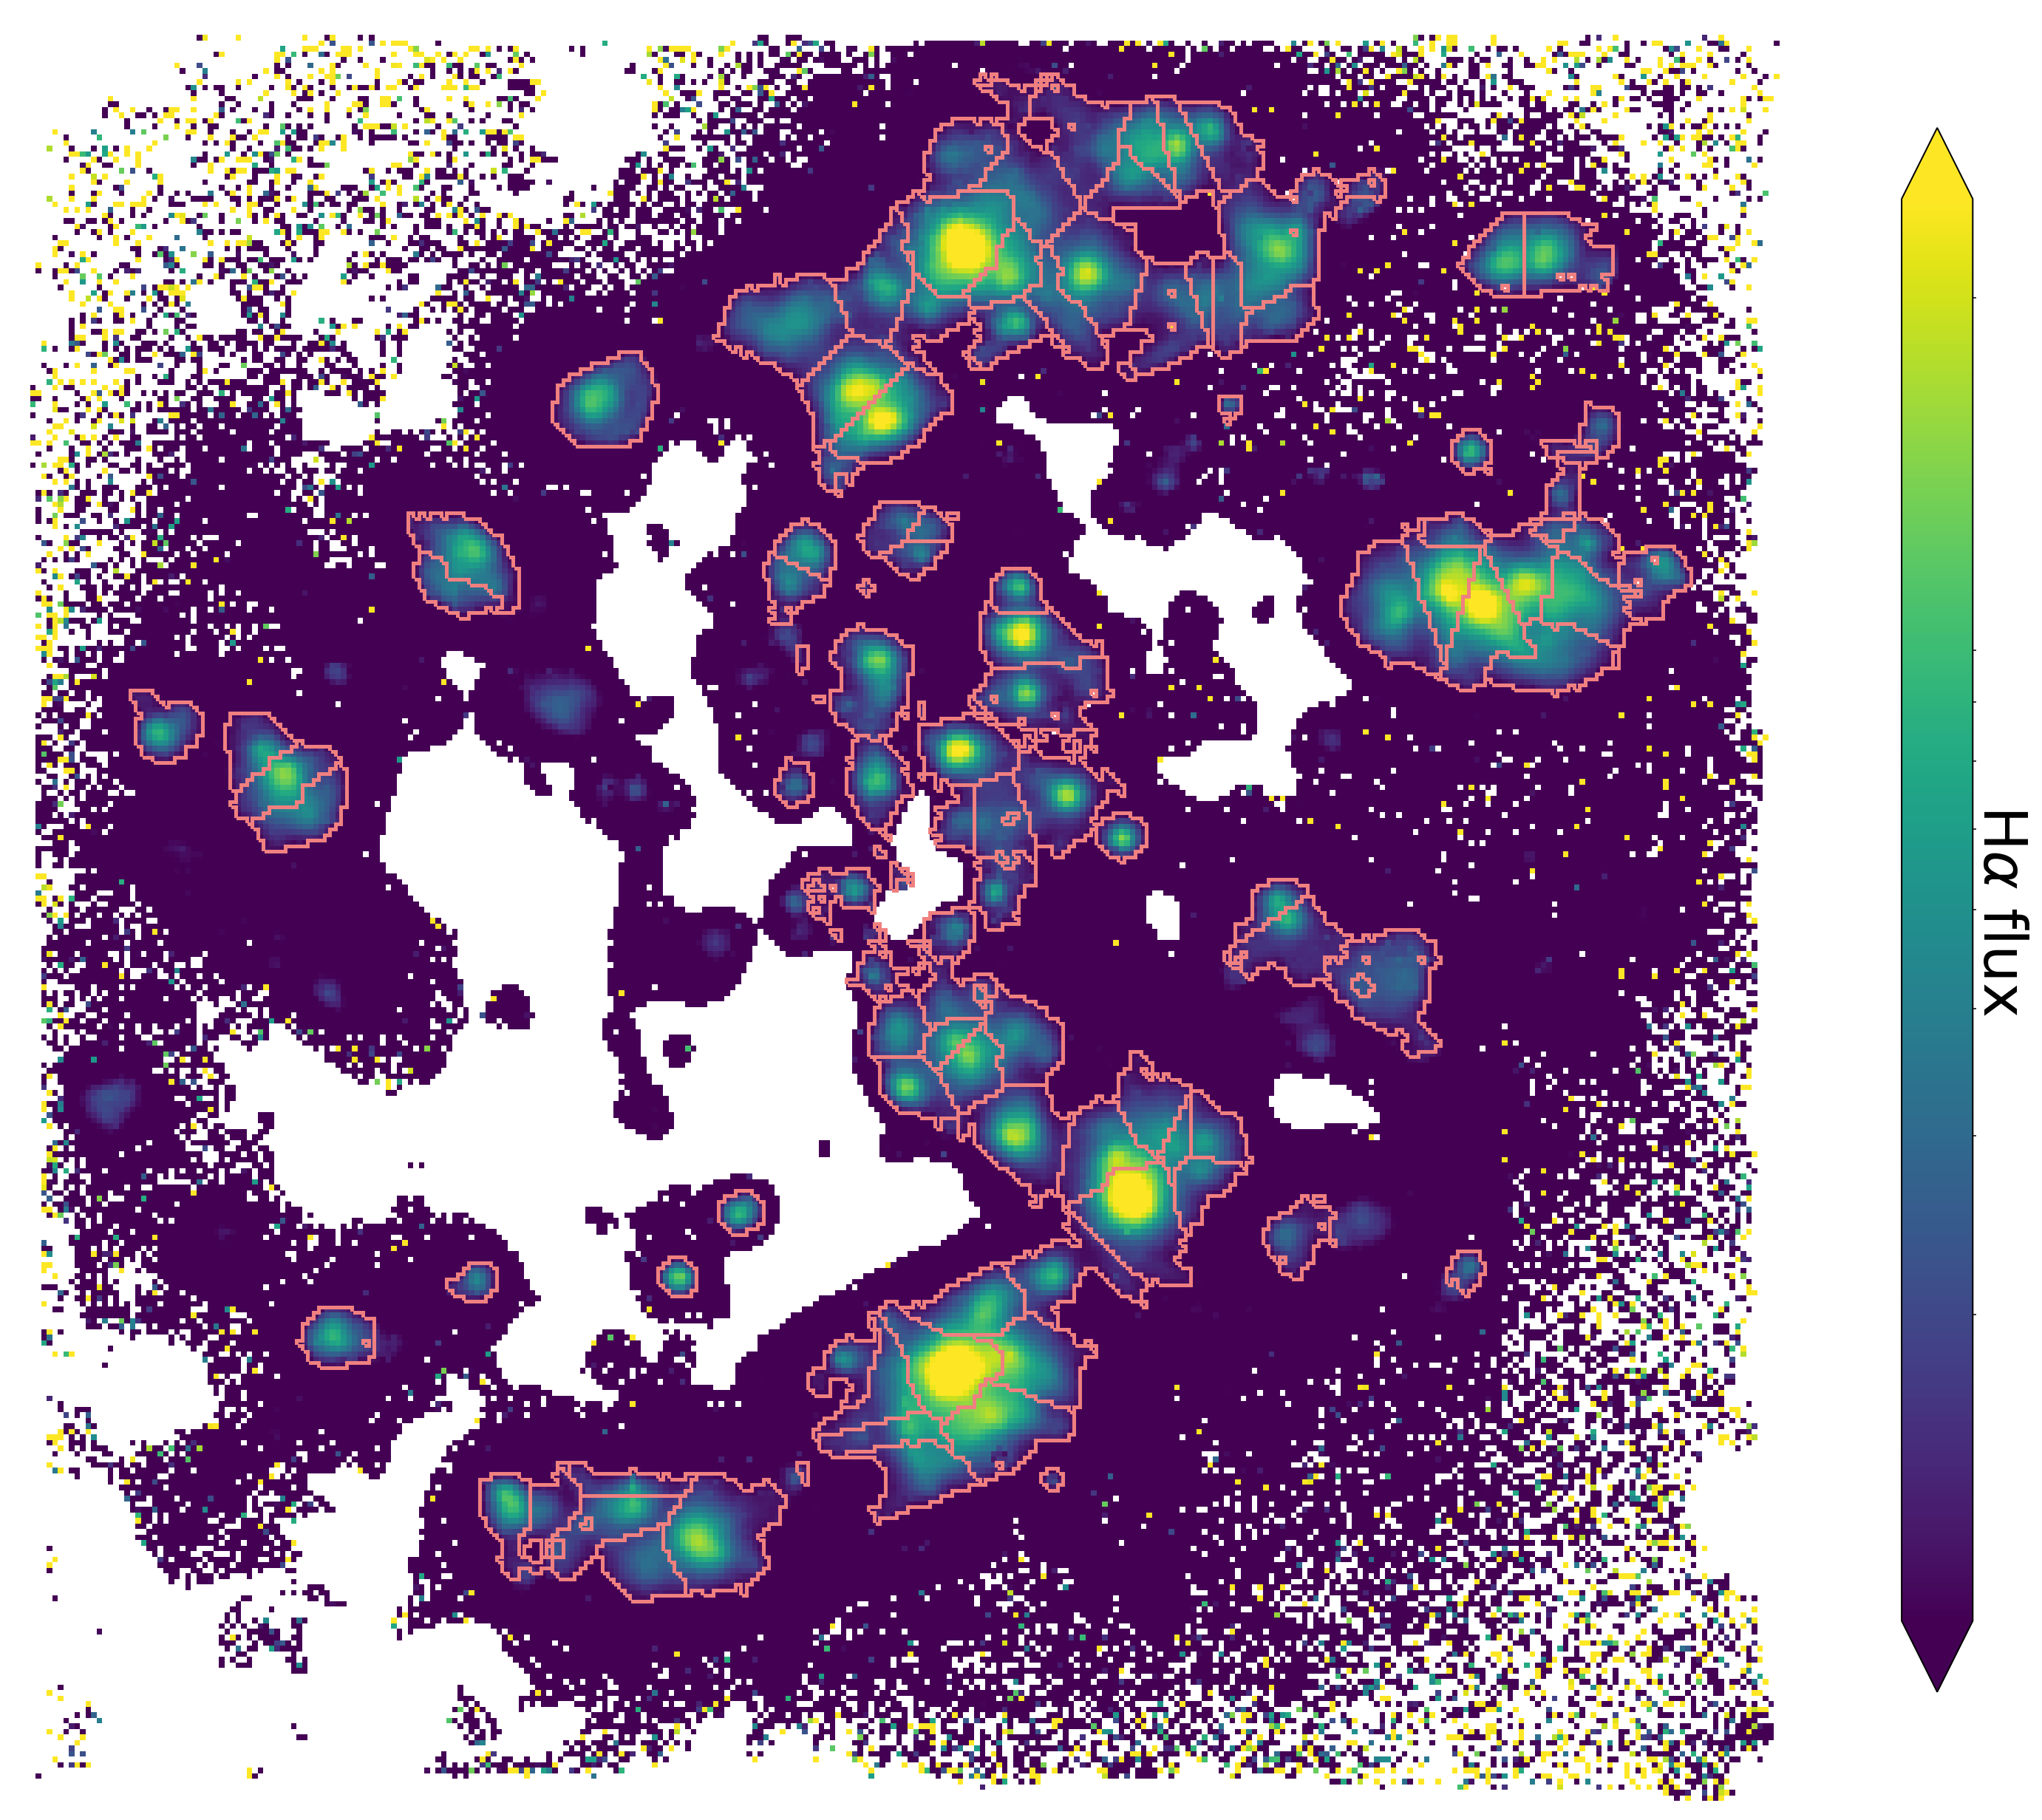
map_region_outline produces a colourmap of the H \(\alpha\) flux, with outlines of the regions overlaid.
from HIIdentify import HIIdentify_plots
HIIdentify_plots.map_region_outline(galaxy_map=ha_flux, \
            seg_map_fname='NGC1483_HII_segmentation_map.fits', vmin=.5e4, vmax=4e4,\
            log_scaling=True, origin='lower', cbar_label=r'H$\alpha$ flux', \
            linewidth=2, tdir='./', galaxy_name='NGC1483', \
            parameter_name='ha')